

Current political situation
The Danish Parliament (Folketinget) is the legislative assembly in Denmark, which means that it passes the acts that apply in Denmark. Folketinget is also responsible for adopting the state's budgets, approving the state's accounts, exercising control of the government and taking part in international cooperation.
Folketinget comprises 179 members, including two members from Greenland and two members from the Faroe Islands. The parties in Folketinget appear from the table below.
Distribution of the members of Folketinget
| Party | Seats |
| The Social Democratic Party (Socialdemokratiet) | 50 |
| The Liberal Party (Venstre) | 24 |
| The Moderates (Moderaterne) | 13 |
| The Green Left (Socialistisk Folkeparti) | 15 |
| The Denmark Democrats (Danmarksdemokraterne) | 15 |
| The Liberal Alliance (Liberal Alliance) | 15 |
| The Conservative Party (Det Konservative Folkeparti) | 10 |
| The Red-Green Alliance (Enhedslisten) | 9 |
| The Social Liberal Party (Radikale Venstre) | 6 |
| The Danish People’s Party (Dansk Folkeparti) | 7 |
| The Alternative (Alternativet) | 5 |
| Inuit Ataqatigiit, Siumut, Sambandsflokkurin, Javnaðarflokkurin | 4 |
Source: The Danish Parliament.
After the 2022 election, the Social Democratic Party, the Liberal Party, and the Moderates formed a government. The government holds 87 out of 179 seats in Folketinget and has 25 ministers.
Current economic situation
According to Eurostat, the Danish GDP was 63,540 € per capita in 2022. The Danish GDP is among the highest in the European Union where the average was 35,220 € per capita in 2022.
Gross domestic product at market prices
| 2012 | 2013 | 2014 | 2015 | 2016 | 2017 | 2018 | 2019 | 2020 | 2021 | 2022 | |
| Current prices, euro per capita | 45,530 | 46,100 | 47,090 | 48,050 | 49,420 | 51,140 | 52,180 | 53,210 | 53,480 | 57,520 | 63,540 |
Source: Eurostat: Gross domestic product at market prices.
In 2022, the annual growth in GDP was 3.6 per cent in relation to the previous period (2021). Like many other countries, Denmark felt the effects of the financial crisis in 2008 and the Covid-19 crisis in 2020. Thus, growth rates were low in the years following 2008 and in 2020.
Real GDP growth (annual, pct.)
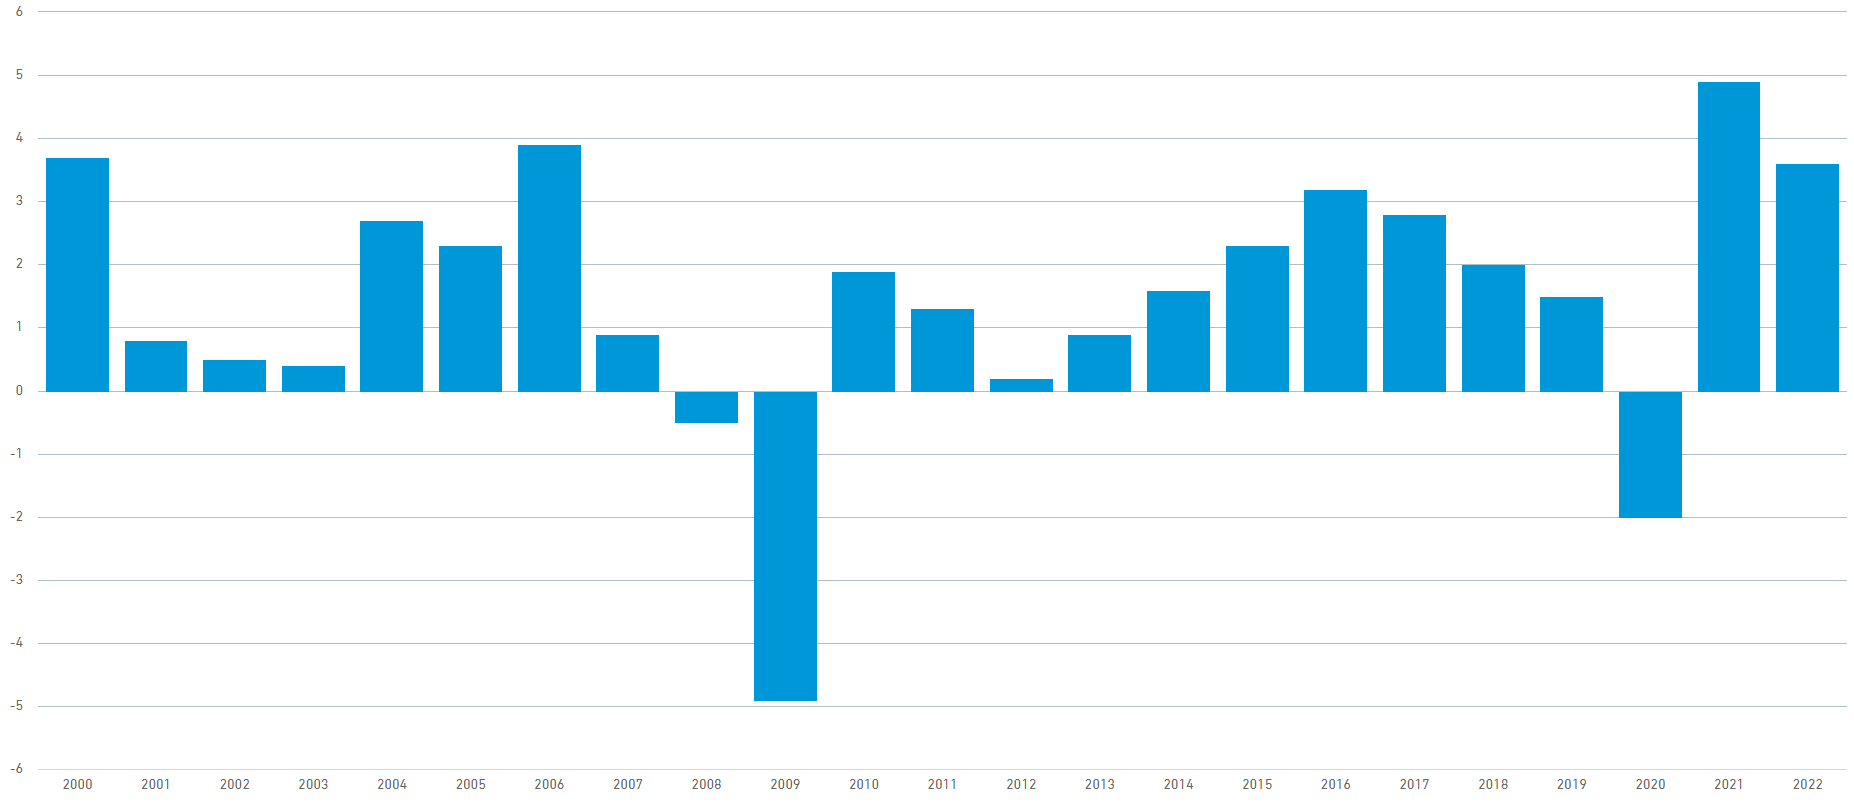
Source: Statistics Denmark.
According to OECD’s Education at a Glance 2022, 5.3 per cent of the Danish GDP was spent on education from primary to tertiary education:
- 1.6 per cent was spent on all primary education;
- 1.9 per cent was spent on all secondary education;
- 1.8 per cent was spent on all tertiary education.
The figure below shows the total expenditure on educational institutions as a percentage of GDP in which Denmark lies above the OECD average.
Total expenditure on educational institutions as a percentage of GDP (2019)
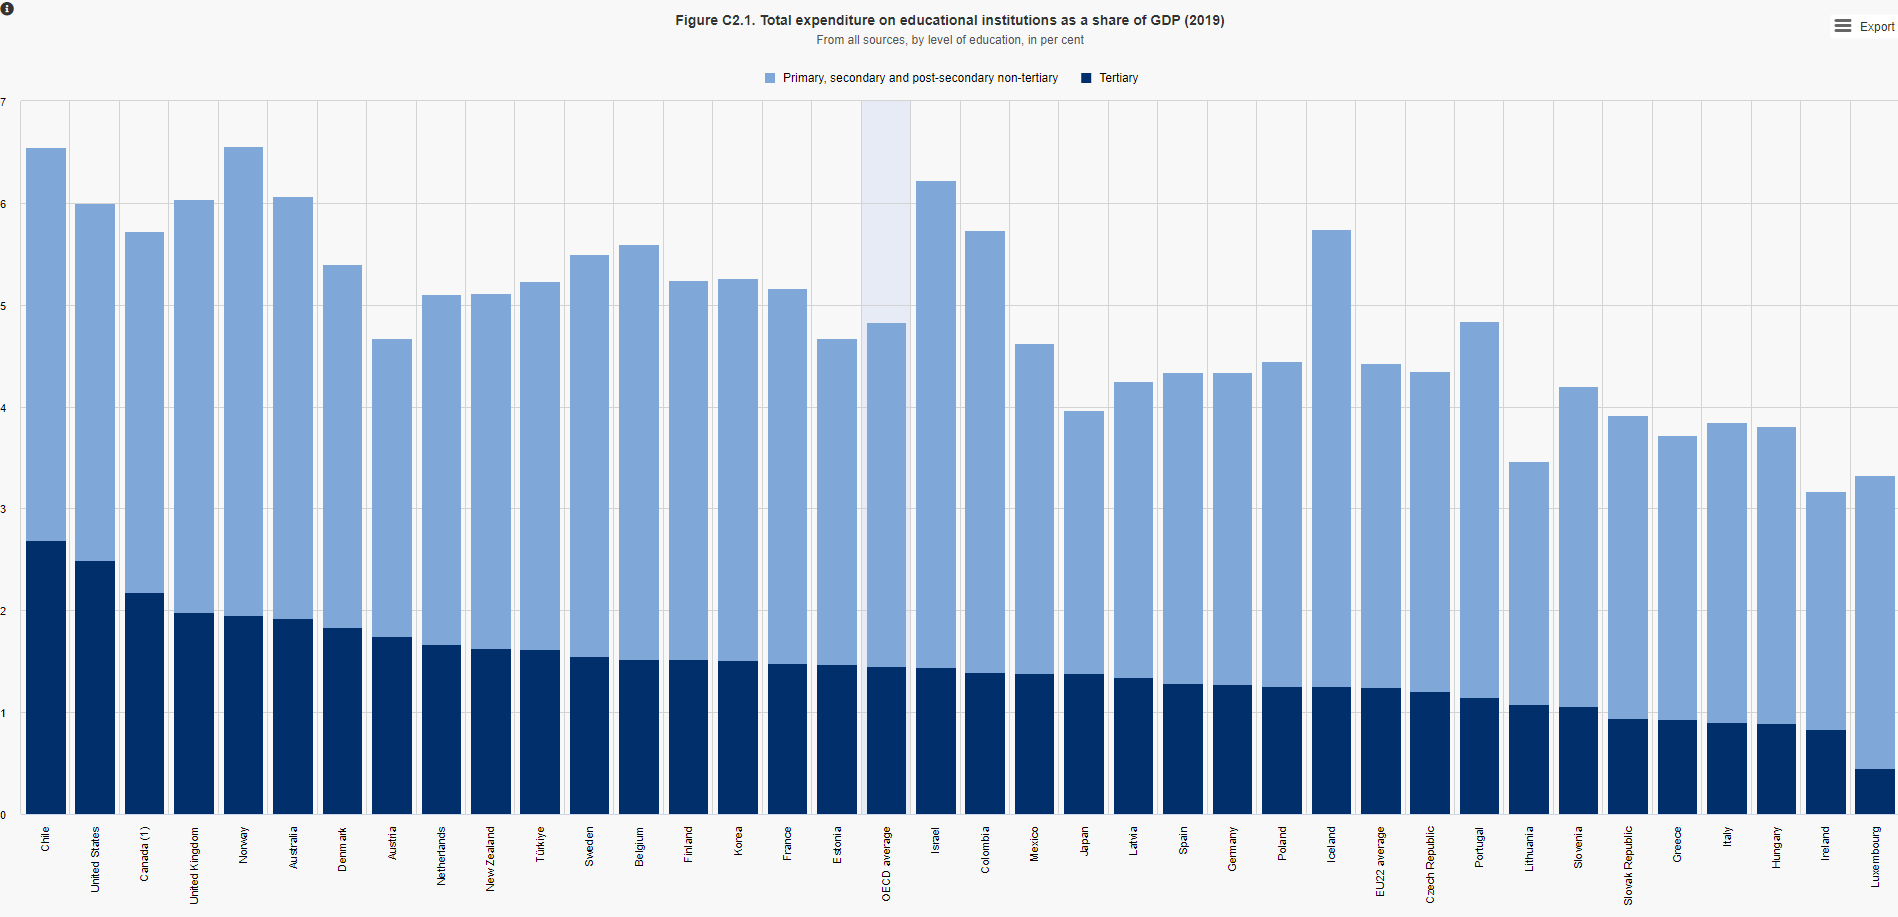
Source: Education at a Glance 2022: OECD Indicators. Figure C2.1.
Educational attainment level of the adult population
The table below shows the educational attainment of 25-64-year-olds in 2021.
Education attainment of 25-64-year-olds (2021)
| Primary and lower secondary level | 18 % |
| Upper secondary level | 40 % |
| Short cycle tertiary level | 5 % |
| Bachelor’s or equivalent level | 21 % |
| Master’s or equivalent level | 15 % |
| Doctoral or equivalent level | 1 % |
Source: Education at a Glance 2022: OECD Indicators. Table A1.1.
The table below shows the percentage of 25-34-year-olds with a given level of education as the highest level attained in 2011 and 2021.
Trends in educational attainment of 25-34-year-olds, by gender (2011 and 2021)
| Below upper secondary education | Upper secondary education | Higher education | ||||
| 2011 | 2021 | 2011 | 2021 | 2011 | 2021 | |
| Men | 23 % | 19 % | 46 % | 40 % | 31 % | 41 % |
| Women | 16 % | 13 % | 37 % | 29 % | 47 % | 58 % |
| In total | 19 % | 16 % | 42 % | 35 % | 39 % | 49 % |
Source: Education at a Glance 2022: OECD Indicators. Table A1.2.
The table shows that an increasing share of 25-34-year-olds has completed an education at higher educational level. In 2011, 39 per cent had a higher educational degree, whereas in 2021 it was 49 per cent. Both the share of 25-34-year-olds whose highest level attained is below upper secondary education, and the share of 25-34-year-olds whose highest level attained is upper secondary education, has decreased from 2011 to 2021.
References
Bibliography
Eurostat, 2023: Gross domestic product at market prices. [Accessed 4 April 2023]
Folketinget, 2024: The Distribution of Mandates (Mandatfordelingen). [Accessed 7 August 2024]
OECD, 2022: Education at a Glance 2022: OECD Indicators. OECD Publishing, Paris. [Accessed 4 April 2023]
Statistics Denmark (Danmarks Statistik), 2023: Economy (Økonomi). [Accessed 4 April 2023]